


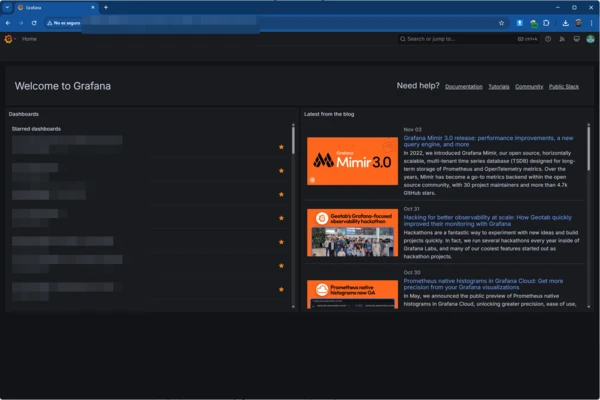
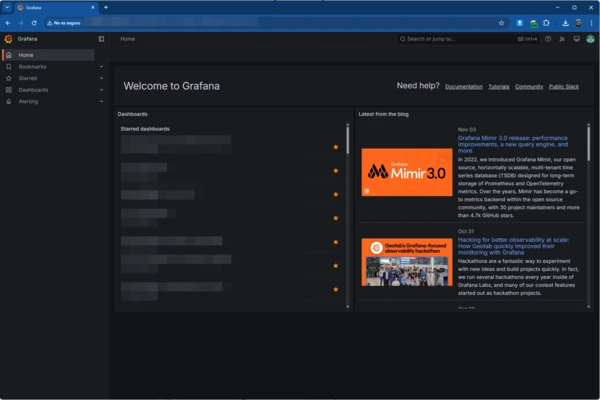
Grafana is an open-source data visualization and monitoring platform that lets you connect data from different sources and display it through customizable dashboards. It can be used to monitor applications, infrastructure, services, databases, and other technical or business data.
Grafana supports a wide range of data sources, including SQL and NoSQL databases, Kubernetes, cloud services such as AWS, Azure, and Google Cloud, as well as services like Google Sheets and IoT devices. Data can be visualized in a single dashboard without requiring you to migrate it to another backend.
Dashboards can be customized with different charts, metrics, tables, and other visualization panels. Grafana also supports queries, data transformations, annotations, and filtering tools for analyzing trends and relationships between data sets.
Grafana provides an alerting system for monitoring metrics and detecting conditions such as service outages or performance issues. Alerts can be configured with different notification channels, including email and supported messaging services.
The platform also supports plugins for additional data sources, visualizations, and integrations. Dashboards can be shared with other users or published for external access, while Grafana's web and mobile interfaces provide access to monitoring data across different devices.