

Gnuplot is a free and open-source command-line graphing and data visualization tool designed for scientific plotting, mathematical visualization, and technical data analysis.
Originally developed in the late 1980s, Gnuplot has become a popular choice among researchers, engineers, and developers who need to create accurate 2D and 3D graphs from mathematical functions or large datasets.
It supports multiple data formats, scripting automation, and integration with programming languages such as Python, C, and LaTeX.
Key Features
2D and 3D Plotting
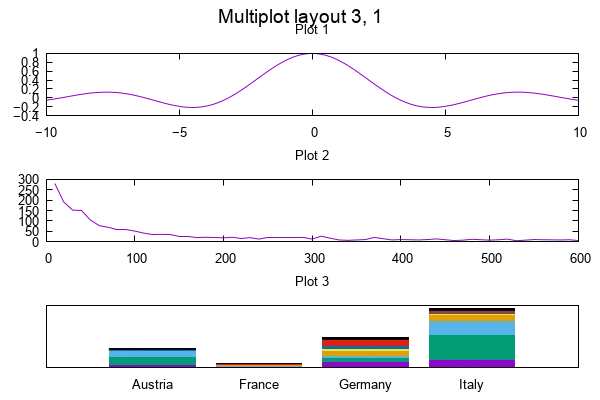
Create various types of visualizations, including:
- Line graphs
- Scatter plots
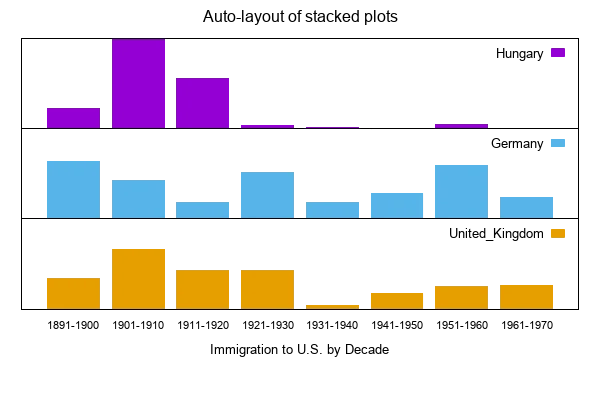
- Bar charts
- Contour plots
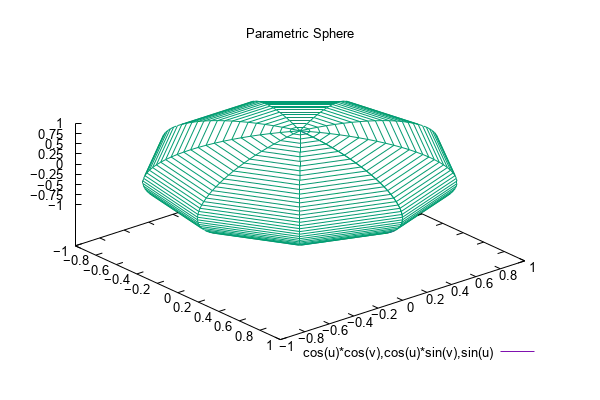
- Surface plots
- Function graphs
Multiple Export Formats
Export generated charts to popular formats:
- PNG
- JPEG
- SVG
- EPS
Script-Based Automation
- Create reusable plotting scripts.
- Automate graph generation.
- Generate consistent results for repeated analysis.
Data Import Support
Supports data from:
- CSV files
- Text files
- External data sources
- Mathematical expressions
Advanced Customization
Control nearly every aspect of a graph:
- Axis scaling
- Labels and titles
- Grid settings
- Legends
- Line styles
- Output formatting
Mathematical Functions
- Plot equations and functions.
- Perform mathematical calculations.
- Visualize scientific data.
Cross-Platform Support
Available for:
- Windows
- macOS
- Linux
- Unix-based systems
User Interface
Gnuplot mainly uses a command-line interface (CLI) instead of a traditional graphical interface.
Users enter commands directly or execute script files to generate graphs. While it requires some command-line knowledge, the scripting workflow provides powerful automation and precise control.
Third-party GUI frontends are also available for users who prefer a graphical workflow.
Installation and Setup
- Download the Gnuplot installer.
- Run the installation package.
- Select the installation directory.
- Enable PATH configuration if required.
- Open Command Prompt or Terminal and run:
gnuplot
to verify the installation.
How to Use Gnuplot
Basic workflow:
- Launch Gnuplot from the command line.
- Enter plotting commands.
- Load data files or mathematical expressions.
- Customize graph settings.
- Export the final graph.
Example:
plot sin(x)
You can also create .plt script files for automated plotting tasks.
System Requirements
- OS: Windows 7, 8, 10, 11 (32-bit and 64-bit)
- Processor: 1 GHz or faster
- RAM: 512 MB minimum
- Storage: About 50 MB free disk space
- Optional: Python or LaTeX integration tools
PROS
- Free and open-source
- High-quality scientific plotting
- Supports 2D and 3D visualization
- Lightweight and fast
- Extensive customization options
- Cross-platform support
- Powerful scripting capabilities
CONS
- No built-in modern GUI
- Requires command-line knowledge
- Steeper learning curve for beginners
- Limited built-in data processing features
Alternatives
- MATLAB – Professional numerical computing and visualization platform.
- GNU Octave – Free MATLAB-compatible scientific computing environment.
- Matplotlib – Popular Python plotting library.
Conclusion
Gnuplot is a powerful scientific plotting tool for researchers, engineers, and developers who need precise and customizable data visualization.
Its lightweight design, scripting support, and ability to generate high-quality 2D and 3D graphs make it an excellent choice for technical analysis and scientific computing.
Note: Gnuplot is completely free and open-source.